Nagios – Monitor Your Servers
Nagios now known as Nagios Core, is a free and open source computer-software application that monitors systems, networks and infrastructure. Nagios offers monitoring and alerting services for servers, switches, applications and services. It alerts users when things go wrong and alerts them a second time when the problem has been resolved.
NagiosXI: Monitoring of all mission-critical infrastructure components on any operating system.
Nagios Log Server: Make sense of your data. See security threats, audit any system, identify trends and more.
Nagios Network Analyzer: You want to find bandwidth bottlenecks.
Nagios is not simple to set up. It relies on setting up various Hosts and services. Hosts are usually physical servers that you want to monitor and services are all the services you want to monitor.
Nagios is very flexible and can be expanded easily with the use of plugins, if you want to monitor something there is usually a plugin available. If you have a any server running openmanage software there is even a plugin that allows the temperature of your server to be monitored.
Nagios comes with lot of dependency on third party tools state of art visualizations. Configuring these add ons is not easy-to-go task. Plus you have to be a ninja when it’s about customized visualization.
Nagios is known to be difficult for configuration. Most of the problems are due to limitations of the native Nagios structure.The core issue with all of these approaches is that there is no auto-configuration, don’t detect application instances properly or let’s say consistently, and configuration of checks is of course a pain.
While Nagios depends on third party tools to process data from Syslog. Also, Nagios makes no distinction among different types of devices like servers, routers, or switches. Nagios treats every device generically as a host.
Whereas flexibility is the feature that sets Nagios as monitoring tool, the flexibility of Nagios becomes a two-edged sword. In case of Nagios Installation and configuration also require extensive knowledge of Linux and considerable time too!
Nagios Monitoring:
Monitoring of network services such as SMTP, POP2, HTTP, NNTP, ICMP, SNMP, FTP, SSH.
Monitoring of host resources such as processor load, disk usage, system log on a majority of network operating systems, including Microsoft Windows, using monitoring agents.
Monitoring of any hardware like probes for temperature, alarms,etc. which have the ability to send collected data via a network to specifically written plugins.
Remote monitoring using Nagios Remote Plugin Executor or through SSH or SSL encrypted tunnels.
Parallelized service checks and automatic log file rotation.
Support for implementing redundant monitoring hosts, performance data graphing and database backend.
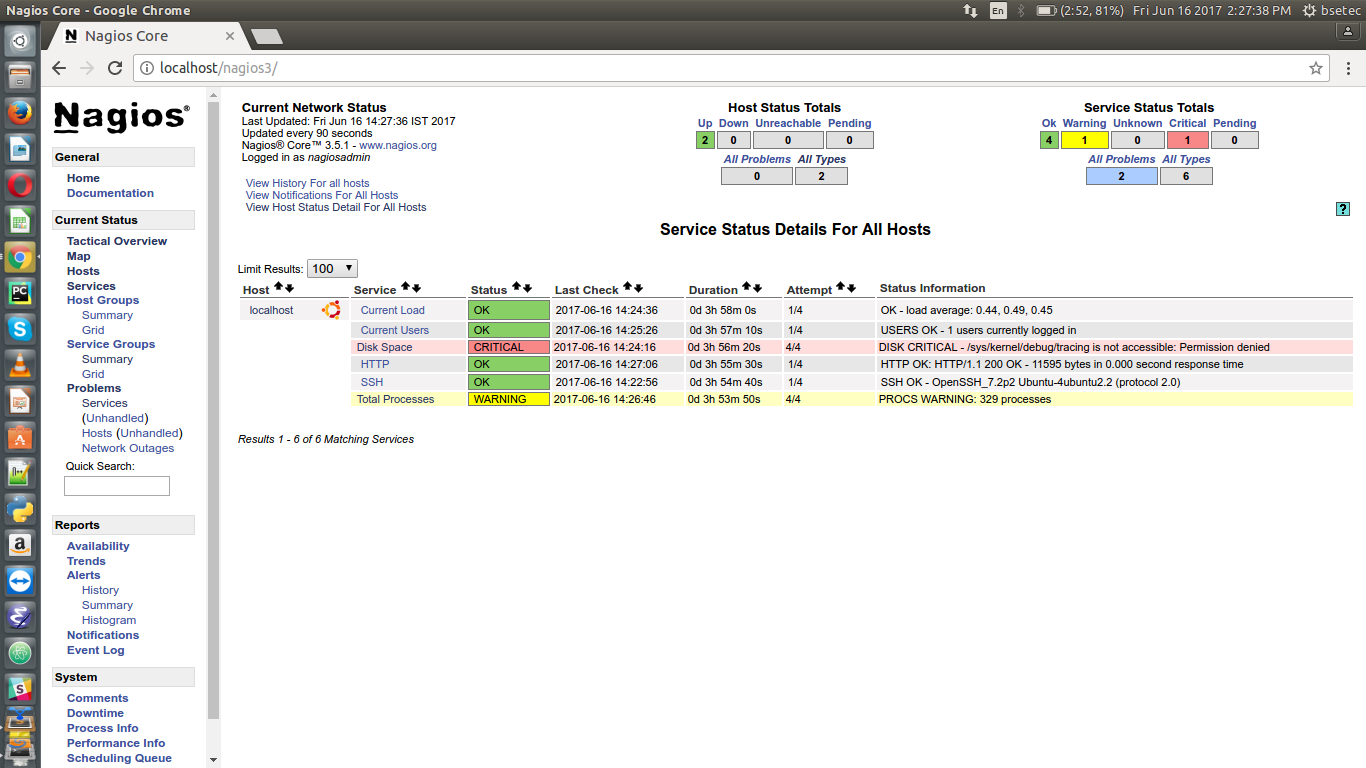
A web-interface for viewing current network status, notifications, problem history, log files, etc.
Nagios Agents:
NRPE — Nagios Remote Plugin Executor
NRDP — Nagios Remote Data Processor
NSClient++ — (program used to monitor Windows machines)
NCPA — Nagios cross Platform Agent


